AXY:Linux MIB
Contents
Introduction
This documentumation explains most parts of the Linux MIB. It is intended for the following users:
- softMC developers who are compiling and link C/C++ code
- QA teams
- Managers engaged in MIB development
MIB software components
The software on a common Linux MIB has two main types.
The first type is software controlled by Manz, who builds and maintains the source code. The second type is software over which Manzhas no control, such as third-party binaries.
The first type includes:
- The Linux operating system. This includes all services and utilities along with their shared objects (aka dll) which take part of maintaining the operating system.
- The Linux Kernel. The core of the operating system.
- mc. Manz’s motion control and its bash scripts extensions.
- /FFS0 with its mc basic programs.
- core dumper. Daemon used to redirect core files.
- pkgd. Package manager.
- various in house drivers,such as , sercos 2, ethercat and so on.
- In the future, any third party software that is added. Like pnp plugins and 3s.
All of the above software is built from source code. We do not ship any other component without its source code. Binaries passed to MIB through the aico are not considered part of Linux MIB system.
Further information of each component is detailed in the rest of this paper.
Accessing the MIB
The MIB is fully access-able from any machine. Accessing the LinuxMIB can be done in two ways, secure shell and rs232 connection.
Access LinuxMIB through rs232
I assume the user is familiar with rs232 connection.
In windows User can access the MIB through hyperterminal or putty. putty.exe can be downloaded from http://www.chiark.greenend.org.uk/~sgtatham/putty/download.html.
Rs232 configuration
Speed 115200
StopBits: 1
Data: 8
Parity:Odd ( N)
Once connected a login session would appear
manz login:
enter root
and then:
Password:
Enter 1-login11.
Obtaining LinuxMIB IP
If you have aico around, use “Select Device” and look for Linux. This should be some LinuxMIB ip. The other way is to access through rs232 as act as bellow:
~ # ifconfig
eth0 Link encap:Ethernet HWaddr 00:50:C2:5D:0F:5E
inet addr:10.4.20.83 Bcast:10.4.20.255 Mask:255.255.255.0
UP BROADCAST RUNNING MULTICAST MTU:1500 Metric:1
RX packets:92287 errors:0 dropped:0 overruns:0 frame:0
TX packets:4462 errors:0 dropped:0 overruns:0 carrier:0
collisions:0 txqueuelen:1000
RX bytes:13389368 (12.7 MiB) TX bytes:431984 (421.8 KiB)
lo Link encap:Local Loopback
inet addr:127.0.0.1 Mask:255.0.0.0
UP LOOPBACK RUNNING MTU:16436 Metric:1
RX packets:9 errors:0 dropped:0 overruns:0 frame:0
TX packets:9 errors:0 dropped:0 overruns:0 carrier:0
collisions:0 txqueuelen:0
RX bytes:612 (612.0 B) TX bytes:612 (612.0 B)
Access LinuxMIB through secure shell
To access the MIB from windows without direct connection use secure shell, or in short “ssh”.
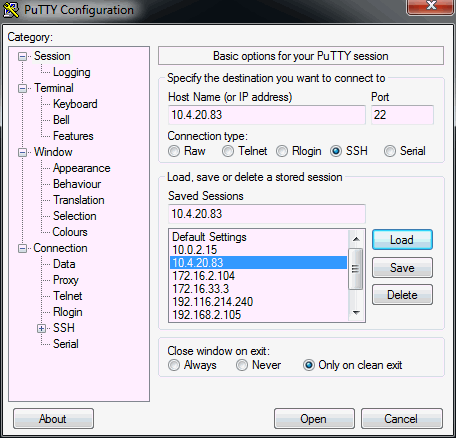
If you login through putty please run it. You should see a window as bellow.
Act according the steps bellow:
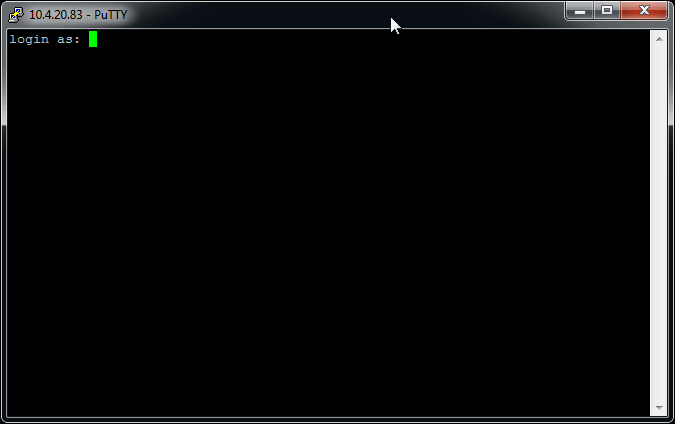
Once you open you get to a login screen as bellow:
Changing the password
It is common to change the login password ( for developers only):
~ # passwd
Changing password for root
New password:
Enter q
You will have a prompt saying
Bad password: too short.
It is ok. “q” is bad password. but you’re likely to login so many times so you better of using this short password.
Then it will ask you ro retype the password,
Retype password:
Enter q again. You do not have to enter “q”, but you will learn that people access anyone’s MIB, so they will expect a short packet to be “q”.
Storage
This section details the storage of the LinuxMIB. In storage we mean, the disks and file systems.
Block Devices
A block device is a device that is accessed with blocks of data. This includes, hard drives, DVD devices, usb flash cards and so on. In the MIB case the block device that holds the file system is called /dev/sda or /dev/hda. It is referred to as /dev/root ( for reasons out this document scope I will not explain why ). Too examin the disk use the fdisk command :
fdisk -l
Disk /dev/sda: 1014 MB, 1014644736 bytes
255 heads, 63 sectors/track, 123 cylinders
Units = cylinders of 16065 * 512 = 8225280 bytes
   Device Boot      Start         End      Blocks  Id System
     /dev/sda1   *           1          57      449850+ 83 Linux
   Partition 1 does not end on cylinder boundary
     /dev/sda2              57         116      475000  83 Linux
   Partition 2 does not end on cylinder boundary
/dev/sda1 is / . /dev/sda2 is the backup partition. The backup partion is used /dev/sda1 is totally corrupted.
File systems
LinuxMIB is composed from several independent file systems. To examine the file systems please enter:
~ # 'df -h'
Filesystem Size Used Available Use% Mounted on
/dev/root 485.5M 83.8M 377.3M 18% /
none 246.9M 4.0K 246.9M 0% /tmp
                           none       246.9M   24.0K   246.8M    0%  /RAM
                           none       246.9M   44.0K   246.8M    0% /var/log
                           none       246.9M   24.0K   246.8M    0% /var/run
                           none       246.9M     0      246.9M   0%   /var/lock
                           none       246.9M     0      246.9M   0%   /var/tmp
                           tmpfs      246.9M     4.0K   246.9M    0%  /dev
- The main file system is called root file system. The root file system is said to be mounted on the mounting point “/”. Any other file system in Linux is mounted on top of the root file system at some directory. Here the root file system is of size of 485MB, and 83MB of it are used.
- /tmp directory is mounted as tmpfs file system. This is a ram file system. It does not survive boots.
- This is the RAM file system used by mc. It is also of type tmpfs.
- /var/log , /var/run, /var/lock, and /var/tmp are tmps file system as well used by different services.
- /dev/ is a file system that holds all device files. it is regenerated with each boot.
- There is a nother file system called /dev/pts , it is visible through the mount command, it hold terminals information.
Basic commands
File and file system
ls
To examine the content the of current directory use ls:
~ # ls
To examine the content of another directory use ls <dir>. For example:
~ # ls /sbin/
adjtimex halt init modprobe setconsole udevadm
blkid hdparm insmod poweroff sfdisk udevd
dhclient hwclock klogd reboot start-stop-daemon udhcpc
fdisk ifconfig loadkmap rmmod sulogin umount.devkit
fsck ifdown lsmod route syslog-ng watchdog
getty ifup modinfo runlevel threads
~ #
The “ls” commands have additional flags, such as : “ls –al” which provides more information about the files.
cat
To examine the content of a text file use the cat. For example:
~ # cat /etc/busybox.conf
you can also create new files with cat by redirecting cat’s output to a new file. For example:
~ # cat /etc/busybox.conf > /tmp/busybox.conf
you can concatenate two files in to a single file by using the >> sign.
For example the command
~ # cat /etc/inet.conf >> /tmp/busybox.conf
will concatenate to /tmp/busybox.conf the content of /etc/inet.conf.
echo
echo is a command that send a string to a file, where a file can be the terminal itself or simply a regular text file or any other file which receives data.
~ # echo hello
Hello
less
less is a textual viewer. It is used to examine text file content in read-only mode. Usage:
~# less <file name>
tail/head
The tail comands prints last line of a file. The head command prints the first few lines of a file. tail is very useful a user wishes to examine how file is being updated , mostly logs.
For example:
~ # tail –f /var/syslog
fsck – check file system consistency
LinuxMIB uses ext3 as its file system, ext3 is a journaling file system which means file system corruption is much less to occur, there are still times where corruptions do happen ( not by abrupt power off but by exploding the file system or deliberately corrupting ).
LinuxMIB executes fsck.ext3 each time it is booted, if you wish to check file system integrity first create the device name:
mknod /dev/hda1 b 3 1
This is because /dev/hda1 does not exist on the MIB and neither /dev/root.
Now issue the fsck command as bellow. I use –n flag to do that in read only mode.
fsck.ext3 –n /dev/hda1
grep
grep prints lines matching a pattern. Example:
/etc # grep mc /usr/bin/mc.sh
/usr/bin/mc
The above command prints each line containing the word “mc”.
or check number of mc core files in the /cores/ directory.
nf=$(ls /cores/mc* | wc -l)
echo $nf
4
awk
awk is a parsing language. The awk command scans an input file searching for some text pattern and when finding this pattern awk act according to the action specified.
For example:
~# awk '$2 == 0 { printf $1 " " $2 " " $3 "\n"}' /proc/interrupts
NMI: 0 Non-maskable
LOC: 0 Local
SPU: 0 Spurious
PMI: 0 Performance
IWI: 0 IRQ
TRM: 0 Thermal
THR: 0 Threshold
MCE: 0 Machine
ERR: 0
MIS: 0
This command prints columns 1, 2 and 3 in the /proc/interrupts if the second column equal 0.
find
find searches for files in directory recursively. For example, if a user wants to find all files named mc in the LinuxMIB:
~ # find / -name mc
/etc/init.d/mc
/usr/bin/mc
watch
The watch command executes a command periodically. For example:
watch –n1 ‘cat /proc/vmstat`
print to screen the file /proc/vmstat .
gzip/gunzip
The gzip command compresses a file. The gunzip command decompress a file.
Example:
gzip /etc/busybox.conf
busybox.conf is compressed and renamed to busybox.conf.gz
to decompress :
gunzip /etc/busybox.cong.gz
a new file /etc/busybox.conf is created.
zcat
zcat is used to print a content of a compressed text file without decompressing it.
Example:
zcat /etc/busybox.conf.gz
This will dump to screen busybox.conf.a
System
free
free returns the amount of RAM in the machine, the amount of used memory in the machine and the amount of used memory in the machine.
~ # free
total used free shared buffers
Mem: 505560 47912 457648 0 1356
Swap: 0 0 0
Total: 505560 47912 457648
lshw
Lists the hardware configuration of the machine.
~ # lshw
manz
description: Computer
product: N/A
vendor: N/A
version: N/A
serial: N/A
width: 32 bits
capabilities: smbios-2.5 dmi-2.5
configuration: administrator_password=disabled boot=oem-specific frontpanel_
password=unknown keyboard_password=unknown power-on_password=disabled
*-core
description: Motherboard
product: MODB
vendor: Kontron Embedded Modules
physical id: 0
version: 05.00
serial: YXEBK0229
*-firmware
description: BIOS
vendor: Phoenix Technologies LTD
physical id: 0
version: MODBR131 (06/27/0808)
size: 104KiB
capacity: 960KiB
capabilities: isa pci pcmcia pnp apm upgrade shadowing escd cdboot acp
i usb agp biosbootspecification
*-cpu
description: CPU
product: Intel(R) Celeron(R) M processor 1.50GHz
vendor: Intel Corp.
physical id: 4
bus info: cpu@0
version: 6.13.8
slot: U2E1
size: 1500MHz
capacity: 2048MHz
width: 32 bits
capabilities: fpu fpu_exception wp vme de pse tsc msr pae mce cx8 sep
mtrr pge mca cmov clflush dts acpi mmx fxsr sse sse2 ss tm pbe nx bts
*-cache:0
description: L1 cache
physical id: 5
slot: L1 Cache
size: 64KiB
capacity: 64KiB
udevadm
udev is part of a linux device model. Udevadm is a tool used to query, monitor and control devices. For example, the hardisk “hda”,has a pci address, it belongs to the block device subsystem, and so on. To get this sort of information in one unified view, we do:
~ # udevadm info -a -p /sys/block/hda
Udevadm info starts with the device specified by the devpath and then
walks up the chain of parent devices. It prints for every device
found, all possible attributes in the udev rules key format.
A rule to match, can be composed by the attributes of the device
and the attributes from one single parent device.
looking at device '/block/hda':
KERNEL=="hda"
SUBSYSTEM=="block"
DRIVER==""
ATTR{range}=="64"
ATTR{ext_range}=="256"
ATTR{removable}=="0"
ATTR{ro}=="0"
ATTR{size}=="1981728"
ATTR{alignment_offset}=="0"
ATTR{discard_alignment}=="0"
ATTR{capability}=="50"
ATTR{stat}==" 342 173 15716 1119 47 25 1
1768 0 2179 2886"
ATTR{inflight}==" 0 0"
ATTR{events}==""
ATTR{events_async}==""
ATTR{events_poll_msecs}=="-1"
As one can observe, a disk called had is part of the block subsystem, there is no driver for it as I did not compile external modules, additional information appears such as its size and some statistics.
Reboot
To reboot the MIB use the “reboot” command.
Poweroff
To turn off the MIB, use the “poweroff” command.
hwclock
To get or set the time to/from RTC hardware clock , use the “hwclock” command. In cases where RTC is broken, “hwlock” will hang or display bad time.
Process
In this section I show some commands related to processes management.
Ps
Use the “ps” command to list system processes. For example, the “ps aux” outputs:
~ # ps aux
USER PID %CPU %MEM VSZ RSS TTY STAT START TIME COMMAND
root 1 0.0 0.1 2076 516 ? Ss 08:03 0:01 init
root 2 0.0 0.0 0 0 ? S 08:03 0:00 [kthreadd]
root 3 0.1 0.0 0 0 ? S 08:03 0:02 [ksoftirqd/0]
root 5 0.0 0.0 0 0 ? S 08:03 0:00 [kworker/u:0]
root 6 0.0 0.0 0 0 ? S 08:03 0:00 [posixcputmr/0]
root 7 0.0 0.0 0 0 ? S< 08:03 0:00 [khelper]
root 8 0.0 0.0 0 0 ? S 08:03 0:00 [kworker/u:1]
root 125 0.0 0.0 0 0 ? S 08:03 0:00 [sync_supers]
root 127 0.0 0.0 0 0 ? S 08:03 0:00 [bdi-default]
root 128 0.0 0.0 0 0 ? S< 08:03 0:00 [kblockd]
root 135 0.0 0.0 0 0 ? S< 08:03 0:00 [ata_sff]
root 142 0.0 0.0 0 0 ? S 08:03 0:00 [khubd]
root 248 0.0 0.0 0 0 ? S 08:03 0:00 [kworker/0:1]
root 268 0.0 0.0 0 0 ? S 08:03 0:00 [kswapd0]
root 269 0.0 0.0 0 0 ? S 08:03 0:00 [fsnotify_mark]
root 271 0.0 0.0 0 0 ? S< 08:03 0:00 [crypto]
root 869 0.0 0.0 0 0 ? S 08:04 0:00 [irq/15-ide0]
root 906 0.0 0.0 0 0 ? S 08:04 0:00 [irq/1-i8042]
root 913 0.0 0.0 0 0 ? S 08:04 0:00 [irq/8-rtc0]
root 921 0.0 0.0 0 0 ? S 08:04 0:00 [kworker/0:2]
root 922 0.0 0.0 0 0 ? S 08:04 0:00 [irq/4-serial]
root 923 0.0 0.0 0 0 ? S 08:04 0:00 [kjournald]
root 945 0.0 0.1 1896 648 ? S<s 08:04 0:00 /sbin/udevd --d
root 999 0.0 0.1 1892 608 ? S< 08:04 0:00 /sbin/udevd --d
root 1002 0.0 0.1 1892 604 ? S< 08:04 0:00 /sbin/udevd --d
root 1017 0.0 0.1 2992 716 ? Ss 08:04 0:00 /sbin/syslog-ng
root 1025 0.0 0.1 3932 996 ? Ss 08:04 0:00 /usr/sbin/sshd
root 1045 0.0 0.0 0 0 ? S 08:04 0:00 [irq/9-eth0]
root 1056 0.0 0.0 0 0 ? S 08:04 0:00 [irq/11-srcsII]
root 1075 99.7 0.0 1528 196 ? Rs 08:04 31:12 /usr/bin/pkgd /
root 1079 0.0 0.1 2080 544 ttyS0 Ss+ 08:04 0:00 /sbin/getty -L
root 1093 0.0 0.3 6536 2004 ? Ss 08:04 0:00 sshd: root@pts/
root 1097 0.0 0.1 2080 632 pts/0 Ss+ 08:04 0:00 -sh
root 1107 0.0 0.3 6536 1988 ? Ss 08:05 0:00 sshd: root@pts/
root 1111 0.0 0.1 2080 664 pts/1 Ss 08:05 0:00 -sh
root 1146 0.0 0.0 0 0 ? S 08:25 0:00 [flush-3:0]
root 1177 0.2 0.3 6536 1988 ? Ss 08:35 0:00 sshd: root@pts/
root 1181 0.0 0.1 2080 608 pts/2 Ss 08:35 0:00 -sh
root 1182 3.2 5.1 42140 26172 pts/2 Sl+ 08:35 0:00 mc
root 1209 0.0 0.1 2228 824 pts/1 R+ 08:35 0:00 ps aux
all processes in the entire operating system along with their memory consumption, state, pid, cpu usage and so on. As one can see the next to last process is mc itself, so where are his threads. For this I created an abbreviation called threads:
~ # threads
Warning: bad ps syntax, perhaps a bogus '-'? See http://procps.sf.net/faq.html
PID TID CLS RTPRIO NI PRI PSR %CPU STAT WCHAN COMMAND
1 1 TS - 0 19 0 0.0 Ss wait init
2 2 TS - 0 19 0 0.0 S kthreadd kthreadd
3 3 RR 99 - 139 0 0.1 S run_ksoftirqd ksoftirqd/0
5 5 TS - 0 19 0 0.0 S worker_thread kworker/u:0
6 6 RR 16 - 56 0 0.0 S posix_cpu_time posixcputmr/0
7 7 TS - -20 39 0 0.0 S< rescuer_thread khelper
8 8 TS - 0 19 0 0.0 S worker_thread kworker/u:1
125 125 TS - 0 19 0 0.0 S bdi_sync_super sync_supers
127 127 TS - 0 19 0 0.0 S bdi_forker_thr bdi-default
128 128 TS - -20 39 0 0.0 S< rescuer_thread kblockd
135 135 TS - -20 39 0 0.0 S< rescuer_thread ata_sff
142 142 TS - 0 19 0 0.0 S hub_thread khubd
248 248 TS - 0 19 0 0.0 S worker_thread kworker/0:1
268 268 TS - 0 19 0 0.0 S kswapd_try_to_ kswapd0
269 269 TS - 0 19 0 0.0 S fsnotify_mark_ fsnotify_mark
271 271 TS - -20 39 0 0.0 S< rescuer_thread crypto
869 869 FF 50 - 90 0 0.0 S irq_thread irq/15-ide0
906 906 RR 16 - 56 0 0.0 S irq_thread irq/1-i8042
913 913 RR 16 - 56 0 0.0 S irq_thread irq/8-rtc0
921 921 TS - 0 19 0 0.0 S worker_thread kworker/0:2
922 922 RR 16 - 56 0 0.0 S irq_thread irq/4-serial
923 923 TS - 0 19 0 0.0 S kjournald kjournald
945 945 TS - -4 23 0 0.0 S<s poll_schedule_ udevd
999 999 TS - -2 21 0 0.0 S< poll_schedule_ udevd
1002 1002 TS - -2 21 0 0.0 S< poll_schedule_ udevd
1017 1017 TS - 0 19 0 0.0 Ss poll_schedule_ syslog-ng
1025 1025 TS - 0 19 0 0.0 Ss poll_schedule_ sshd
1045 1045 RR 16 - 56 0 0.0 S irq_thread irq/9-eth0
1056 1056 RR 99 - 139 0 0.0 S irq_thread irq/11-srcsII
1075 1075 TS - 0 19 0 99.5 Rs - pkgd
1079 1079 TS - 0 19 0 0.0 Ss+ n_tty_read getty
1093 1093 TS - 0 19 0 0.0 Ss poll_schedule_ sshd
1097 1097 TS - 0 19 0 0.0 Ss+ poll_schedule_ sh
1146 1146 TS - 0 19 0 0.0 S bdi_writeback_ flush-3:0
1177 1177 TS - 0 19 0 0.0 Ss poll_schedule_ sshd
1181 1181 TS - 0 19 0 0.0 Ss wait sh
1182 1182 TS - 0 19 0 0.0 Sl+ futex_wait_que mc
1182 1184 RR 1 - 41 0 0.0 Sl+ wq_sleep jexec
1182 1186 RR 25 - 65 0 0.0 Sl+ semtimedop tErrHndl
1182 1187 RR 16 - 56 0 0.0 Sl+ semtimedop tLogger
1182 1188 RR 16 - 56 0 0.0 Sl+ inet_csk_wait_ cli
1182 1189 RR 16 - 56 0 0.0 Sl+ inet_csk_wait_ tEthernInp
1182 1190 RR 16 - 56 0 0.0 Sl+ wait_for_packe tEthernOut
1182 1191 RR 16 - 56 0 0.0 Sl+ inet_csk_wait_ tEthernInp2
1182 1192 RR 16 - 56 0 0.0 Sl+ wait_for_packe tEthernOut2
1182 1193 RR 16 - 56 0 0.0 Sl+ inet_csk_wait_ tEthernInp0
1182 1194 RR 16 - 56 0 0.0 Sl+ wait_for_packe tEthernOut0
1182 1195 RR 16 - 56 0 0.0 Sl+ inet_csk_wait_ tEthernInp3
1182 1196 RR 16 - 56 0 0.0 Sl+ wait_for_packe tEthernOut3
1182 1197 RR 16 - 56 0 0.0 Sl+ wait_for_packe RbootPd
1182 1198 RR 16 - 56 0 0.0 Sl+ poll_schedule_ tVirtualInp
1182 1199 RR 26 - 66 0 0.0 Sl+ hrtimer_nanosl tBit
1182 1200 RR 27 - 67 0 0.4 Sl+ semtimedop tSpy
1182 1201 RR 21 - 61 0 0.1 Sl+ semtimedop tScHandler
1182 1202 RR 20 - 60 0 0.0 Sl+ semtimedop tScServer
1182 1203 RR 21 - 61 0 0.3 SNl+ sercosII_read sercosFun
1182 1204 RR 23 - 63 0 0.0 SNl+ semtimedop MotManager
1182 1207 RR 28 - 68 0 0.1 SNl+ semtimedop tRecPeriodic
1182 1208 RR 29 - 69 0 0.0 SNl+ semtimedop tEvent
1210 1210 TS - 0 19 0 0.6 Ss poll_schedule_ sshd
1214 1214 TS - 0 19 0 0.0 Ss wait sh
1215 1215 TS - 0 19 0 0.0 S+ wait sh
1216 1216 TS - 0 19 0 0.0 R+ - ps
The "threads" is actually a shortcut for the following ps command:
ps -axH -eo pid,tid,class,rtprio,ni,pri,psr,pcpu,stat,wchan:14,comm
The above command presents the following information for each task in the operating system:
pid = process id of the parent not-detached task
tid = process id of the task within parent task – what we refer as thread.
class = scheduling class. TS = OTHER, RR = round robin, FF = fifo. - = not reported
rtprio = real time priority, ranging from 99 to 0. When 99 is strongest.
ni = niceness. Ranging from -19 to 20.
pri = static priority.
psr = processor id.
pcpu = overall cpu usage
stat = process state. R for runnable or S for sleeping, Z for zombie.
wchan = kernel function where process is waiting. If process is running a dash is displayed
comm = name of process
If you wish to sort the list by the processes real time priority, use the following command:
threads | sort –k4
This command sorts the list according by the fourth column.
Kill
To terminate a running process use the kill command. Kill needs the process id , so many times you can simply type:
kill -9 $(pidof mc)
Which means, kill anyway, the mc by its process id.
Top
top is an interactive view of displaying system tasks. It refreshes the list every 1 or more second.
~ # top
top - 09:21:51 up 1:17, 4 users, load average: 1.04, 1.03, 1.01
Tasks: 42 total, 2 running, 40 sleeping, 0 stopped, 0 zombie
Cpu(s): 29.6%us, 70.3%sy, 0.1%ni, 0.0%id, 0.0%wa, 0.0%hi, 0.0%si, 0.0%st
Mem: 505536k total, 49120k used, 456416k free, 860k buffers
Swap: 0k total, 0k used, 0k free, 12288k cached
PID USER PR NI VIRT RES SHR S %CPU %MEM TIME+ COMMAND
1075 root 20 0 1528 196 148 R 98.9 0.0 77:03.44 pkgd
1056 root RT 0 0 0 0 S 2.0 0.0 0:05.73 irq/11-srcsII
1 root 20 0 2076 520 460 S 0.0 0.1 0:01.17 init
2 root 20 0 0 0 0 S 0.0 0.0 0:00.00 kthreadd
3 root RT 0 0 0 0 S 0.0 0.0 0:07.44 ksoftirqd/0
5 root 20 0 0 0 0 S 0.0 0.0 0:00.01 kworker/u:0
6 root -17 0 0 0 0 S 0.0 0.0 0:00.00 posixcputmr/0
7 root 0 -20 0 0 0 S 0.0 0.0 0:00.00 khelper
8 root 20 0 0 0 0 S 0.0 0.0 0:00.00 kworker/u:1
125 root 20 0 0 0 0 S 0.0 0.0 0:00.00 sync_supers
127 root 20 0 0 0 0 S 0.0 0.0 0:00.00 bdi-default
128 root 0 -20 0 0 0 S 0.0 0.0 0:00.00 kblockd
135 root 0 -20 0 0 0 S 0.0 0.0 0:00.00 ata_sff
142 root 20 0 0 0 0 S 0.0 0.0 0:00.00 khubd
248 root 20 0 0 0 0 S 0.0 0.0 0:00.02 kworker/0:1
268 root 20 0 0 0 0 S 0.0 0.0 0:00.00 kswapd0
269 root 20 0 0 0 0 S 0.0 0.0 0:00.00 fsnotify_mark
271 root 0 -20 0 0 0 S 0.0 0.0 0:00.00 crypto
Top displays a nice summary before the list. Memory usage, cpu usage and so on. Important information is found in this line
Cpu(s): 29.6%us, 70.3%sy, 0.1%ni, 0.0%id, 0.0%wa, 0.0%hi, 0.0%si, 0.0%st
For example:
us is the Cpu usage in user space here is 29.6%
sy is the cpu usage in kernel space is 70%
ni is the niceness of last process
wa is io wait which is the amount of time system is waiting for IO to complete.
hi is hardware interrupt usage
si is soft irqs usage
st is virtualization usage ( always zero in mib)
htop
htop is like top but more interactive. You can asks for different sorting keys, like sort by memory usage, sort by cpu usage and so on.
[[Image:]]
Type F6 and toy with it.
Display process’s maps
To watch a process’ segmented allocation use the following commands:
~ # cat /proc/$(pidof mc)/maps
08048000-08429000 r-xp 00000000 03:01 13462 /usr/bin/mc
08429000-08558000 rwxp 003e1000 03:01 13462 /usr/bin/mc
08558000-085ed000 rwxp 00000000 00:00 0
09afd000-0b060000 rwxp 00000000 00:00 0 [heap]
b5a1c000-b5a1d000 ---p 00000000 00:00 0
b5a1d000-b5a24000 rwxp 00000000 00:00 0
b5a24000-b5a25000 ---p 00000000 00:00 0
b5a25000-b5a30000 rwxp 00000000 00:00 0
b5a30000-b5a31000 ---p 00000000 00:00 0
b5a31000-b5a3c000 rwxp 00000000 00:00 0
b5a3c000-b5a3d000 ---p 00000000 00:00 0
b5a3d000-b5a48000 rwxp 00000000 00:00 0
b5a48000-b5a49000 ---p 00000000 00:00 0
b5a49000-b5a58000 rwxp 00000000 00:00 0
b5a58000-b5a59000 ---p 00000000 00:00 0
b5a59000-b5a5c000 rwxp 00000000 00:00 0
b5a5c000-b5a5d000 ---p 00000000 00:00 0
b5a5d000-b5a64000 rwxp 00000000 00:00 0
b5a64000-b5a65000 ---p 00000000 00:00 0
b5a65000-b5a6c000 rwxp 00000000 00:00 0
b5a6c000-b5a6d000 ---p 00000000 00:00 0
b5a6d000-b5a74000 rwxp 00000000 00:00 0
b5a74000-b5a75000 ---p 00000000 00:00 0
b5a75000-b5a80000 rwxp 00000000 00:00 0
b5a81000-b5a82000 ---p 00000000 00:00 0
b5a82000-b5aa5000 rwxp 00000000 00:00 0
b5aa5000-b5aa6000 ---p 00000000 00:00 0
b5aa6000-b5ac1000 rwxp 00000000 00:00 0
b5ac1000-b5ac2000 ---p 00000000 00:00 0
b5ac2000-b5ac9000 rwxp 00000000 00:00 0
b5ac9000-b5aca000 ---p 00000000 00:00 0
b5aca000-b5aed000 rwxp 00000000 00:00 0
b5aed000-b5aee000 ---p 00000000 00:00 0
b5aee000-b5af5000 rwxp 00000000 00:00 0
b5af5000-b5af6000 ---p 00000000 00:00 0
b5af6000-b5b19000 rwxp 00000000 00:00 0
b5b19000-b5b1a000 ---p 00000000 00:00 0
b5b1a000-b5b21000 rwxp 00000000 00:00 0
b5b21000-b5b22000 ---p 00000000 00:00 0
b5b22000-b5b45000 rwxp 00000000 00:00 0
b5b45000-b5b46000 ---p 00000000 00:00 0
b5b46000-b5b4d000 rwxp 00000000 00:00 0
b5b4d000-b5b4e000 ---p 00000000 00:00 0
b5b4e000-b5c18000 rwxp 00000000 00:00 0
b5c18000-b5c19000 ---p 00000000 00:00 0
b5c19000-b6418000 rwxp 00000000 00:00 0
b6418000-b6419000 ---p 00000000 00:00 0
b6419000-b6420000 rwxp 00000000 00:00 0
b6420000-b6421000 ---p 00000000 00:00 0
b6421000-b6429000 rwxp 00000000 00:00 0
b6429000-b642a000 ---p 00000000 00:00 0
b642a000-b642d000 rwxp 00000000 00:00 0
b642d000-b742d000 rwxs fffe9000000 00:12 2311 /dev/sercosII
b742d000-b742e000 ---p 00000000 00:00 0
b742e000-b7435000 rwxp 00000000 00:00 0
b7435000-b7436000 ---p 00000000 00:00 0
b7436000-b7544000 rwxp 00000000 00:00 0
b7544000-b7679000 r-xp 00000000 03:01 10172 /lib/libc-2.13.so
b7679000-b767a000 ---p 00135000 03:01 10172 /lib/libc-2.13.so
b767a000-b767c000 r-xp 00135000 03:01 10172 /lib/libc-2.13.so
b767c000-b767d000 rwxp 00137000 03:01 10172 /lib/libc-2.13.so
b767d000-b7680000 rwxp 00000000 00:00 0
b7680000-b769b000 r-xp 00000000 03:01 12467 /lib/libgcc_s.so.1
b769b000-b769c000 rwxp 0001a000 03:01 12467 /lib/libgcc_s.so.1
b769c000-b76c1000 r-xp 00000000 03:01 14763 /lib/libm-2.13.so
b76c1000-b76c2000 r-xp 00024000 03:01 14763 /lib/libm-2.13.so
b76c2000-b76c3000 rwxp 00025000 03:01 14763 /lib/libm-2.13.so
b76c3000-b779b000 r-xp 00000000 03:01 9190 /usr/lib/libstdc++.so.6.0.14
b779b000-b779f000 r-xp 000d7000 03:01 9190 /usr/lib/libstdc++.so.6.0.14
b779f000-b77a0000 rwxp 000db000 03:01 9190 /usr/lib/libstdc++.so.6.0.14
b77a0000-b77a8000 rwxp 00000000 00:00 0
b77a8000-b77b0000 r-xp 00000000 03:01 16731 /lib/libcrypt-2.13.so
b77b0000-b77b1000 r-xp 00007000 03:01 16731 /lib/libcrypt-2.13.so
b77b1000-b77b2000 rwxp 00008000 03:01 16731 /lib/libcrypt-2.13.so
b77b2000-b77d9000 rwxp 00000000 00:00 0
b77d9000-b77ed000 r-xp 00000000 03:01 17714 /lib/libpthread-2.13.so
b77ed000-b77ee000 r-xp 00013000 03:01 17714 /lib/libpthread-2.13.so
b77ee000-b77ef000 rwxp 00014000 03:01 17714 /lib/libpthread-2.13.so
b77ef000-b77f1000 rwxp 00000000 00:00 0
b77f1000-b77f7000 r-xp 00000000 03:01 13450 /lib/librt-2.13.so
b77f7000-b77f8000 r-xp 00005000 03:01 13450 /lib/librt-2.13.so
b77f8000-b77f9000 rwxp 00006000 03:01 13450 /lib/librt-2.13.so
b77f9000-b77fb000 r-xp 00000000 03:01 17388 /lib/libdl-2.13.so
b77fb000-b77fc000 r-xp 00001000 03:01 17388 /lib/libdl-2.13.so
b77fc000-b77fd000 rwxp 00002000 03:01 17388 /lib/libdl-2.13.so
b77fd000-b7817000 r-xp 00000000 03:01 16404 /lib/ld-2.13.so
b7817000-b7818000 rwxp 00000000 00:00 0
b7818000-b7819000 r-xp 0001a000 03:01 16404 /lib/ld-2.13.so
b7819000-b781a000 rwxp 0001b000 03:01 16404 /lib/ld-2.13.so
bfd20000-bfd41000 rwxp 00000000 00:00 0 [stack]
ffffe000-fffff000 r-xp 00000000 00:00 0 [vdso]
From left to tight:
- The segment ( also known as vma ) memory addresses
- The segment permission
- The segment offset into the file
- The block device major/minor holding the file
- The size of the segment
chrt
change real time priority. You can control a processes scheduling class and priority level from the command line.
For example:
Ksoftirq is a kernel daemon that is widely used in the kernel.
~ # threads |grep sof
3 3 RR 99 - 139 0 0.1 S run_ksoftirqd ksoftirqd/0
ksoftirq pid is 3. Its real time priority is 99. So , let say we wish to change its priority to 19.
~ # chrt -r -p 19 3
pid 3's current scheduling policy: SCHED_RR
pid 3's current scheduling priority: 99
pid 3's new scheduling policy: SCHED_RR
pid 3's new scheduling priority: 19
and indeed priority changed.
~ # threads | grep sof
3 3 RR 19 - 59 0 0.1 S run_ksoftirqd ksoftirqd/0
Network
ssh sshd and scp
Secure shell is used to access remote machines. Sshd is service running in the target MIB and ssh is the client. You can login (perform ssh) to a MIB and login from a MIB to any other Linux machine. You can copy files with scp to and from Linux machines.
To login to MIB ip 10.4.20.240 from any Linux machine enter:
~ # ssh root@10.4.20.240
The authenticity of host '10.4.20.240 (10.4.20.240)' can't be established.
RSA key fingerprint is ef:f6:72:7f:64:7a:21:d4:8b:c3:b2:db:cf:a0:0f:99.
Are you sure you want to continue connecting (yes/no)? yes
Warning: Permanently added '10.4.20.240' (RSA) to the list of known hosts.
root@10.4.20.240's password:
the first you will asked is enter yes/no. this happens only in the first time you access a remote machine. Enter “yes” and then you will be asked to enter a password, please do. Once entered, you will be in the MIB running in root privileges.
To copy files from Linux machine to another Linux machine in the command line we use scp command: for example, the command:
scp –r /tmp root@10.4.20.240:/root/
will copy tmp directory to to root directory in target machine. The “-r” means recursive copy, which is how we copy directories.
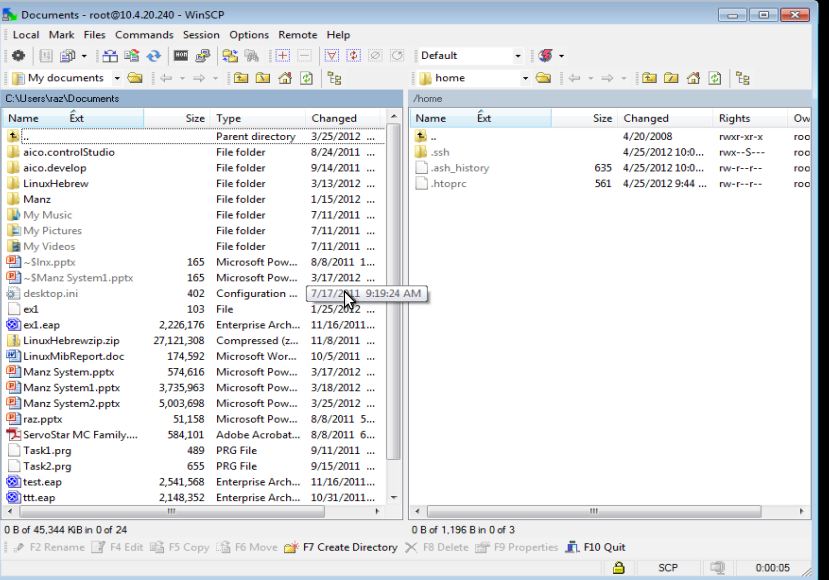
If you copy files from a windows machine to a linux machine you should use winscp.
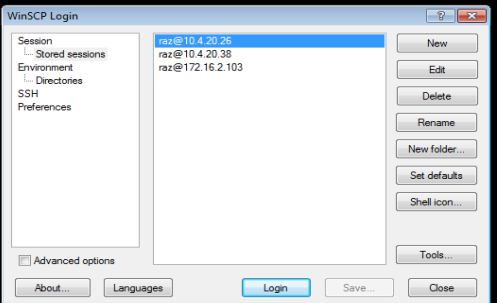
The first window displays a list machines that were accessed previously. If this is the first time you use winscp this list is empty. To copy files to 10.4.20.240 please click on the New button.
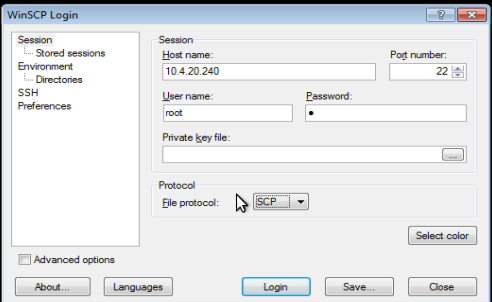
Fill the MIB’s ip. The user name “root”, the password, and change the protocol from sftp to scp. Click on “Save” to save the new machine in the list and then click on Login.
You will windows saying that the command “group” returned error, disregard it, it is because MIB does not have group command, after that you will have the above screen. Now you can simply drag and drop files.
Route
To watch the routing tables just type “route” or “netstat –r”. Here is route output in MIB
Ip 10.4.20.240.
Kernel IP routing table
Destination Gateway Genmask Flags Metric Ref Use Iface
10.0.0.0 * 255.0.0.0 U 0 0 0 eth0
As the reader can see, there is not default route, so if we try to access a different network segment will be getting “unreachable network” . We can only access network on the 10.x.x.x. because the netmask is 255.0.0.0.
The only Ethernet interface a MIB has is eth0.
tcpdump
tcpdump is a packet capture program. To capture packets simply type:
tcpdump
this will fill screen with traffic captures. If you use ssh to access the machine you will see ssh traffic as well. So you probably want to filter out this ssh traffic. To do that enter:
tcpdump ip –i eth0 and not port 22
Which means, capture all traffic on interface eth0, but drop any traffic on directed to port 22.
There are many other ways to capture traffic. Sometimes you need to capture the traffic and want to analize it later with better tools, like wireshark. For this please enter:
tcpdump ip –i eth0 and not port 22 –w foo.cap
This means that the captured data will be passed to a file called foo.cap.
ethtool
ethtool is used to query and control network interfaces.
~ # ethtool eth0
Settings for eth0:
Supported ports: [ TP MII ]
Supported link modes: 10baseT/Half 10baseT/Full
100baseT/Half 100baseT/Full
Supports auto-negotiation: Yes
Advertised link modes: 10baseT/Half 10baseT/Full
100baseT/Half 100baseT/Full
Advertised pause frame use: Symmetric
Advertised auto-negotiation: Yes
Link partner advertised link modes: 10baseT/Half 10baseT/Full
100baseT/Half 100baseT/Full
Link partner advertised pause frame use: Symmetric
Link partner advertised auto-negotiation: Yes
Speed: 100Mb/s
Duplex: Full
Port: MII
PHYAD: 1
Transceiver: internal
Auto-negotiation: on
Supports Wake-on: g
Wake-on: g
Current message level: 0x00000007 (7)
Link detected: yes
Common use for it is checking the link type, 10/100/1000 Mbps and if the network is actually up (Last line: Link Detected).
Boot
Linux MIB boot is a two-phase boot. Once the computer passed the POST stage (Power On Self Test) it passes the control to the operating system. The first operating system is actually a boot loader. The boot loader is called grub – “grand unified boot loader”. Grub has one main purpose, to boot Linux. At the moment, the MIB hardware prevents us from seeing the grub loads. When grub loads it splashes a menu to screen (it is called splashing). This menu is kept in /boot/grub/menu.lst which is accessible through the LinuxMIB.
~ # cat /boot/grub/menu.lst
serial --unit=0 --speed=115200
terminal --timeout=0 serial console
default 0
timeout 0
color cyan/blue white/blue
title Standalone Boot
root (hd0,0)
kernel /boot/bzImage root=/dev/hda1,/dev/hdc1 console=ttyS0,115200
title Network Boot
ifconfig --server= --gateway= --mask= --address=
root (nd)
kernel (nd)/linux root=/dev/nfs console=ttyS0,115200 ip=:::::eth0: nfsroot=
~ #
The boot loader menu has two entries, the first entry boots Linux from the disk, and the second one boots Linux from the network. The first one is the default one.
Grub boots the kernel by loading the kernel file (bzImage) to the main memory and passing it some parameters. Current parameters are:
root=/dev/hda1,/dev/hdc1 console=ttyS0, 115200
This means that the kernel search for a root file system in a block device called /dev/hda1 and if it fails it tries /dev/hdc1. The “console=” means that the rs232 input and output redirected through a device file called /dev/ttyS0 in 115200 speed. These parameters are kernel parameters and do not relate to grub.
BSP
The board specific package I used to create the MIB is Pengutronix. Pengutronix is software builds an entire Linux distribution from scratch. Linux MIB software does not contain any binaries with the sources. So, in this section I will describe how to build the MIB bsp and MC in the virtual disk I supply for this.
Virtual Build Machine
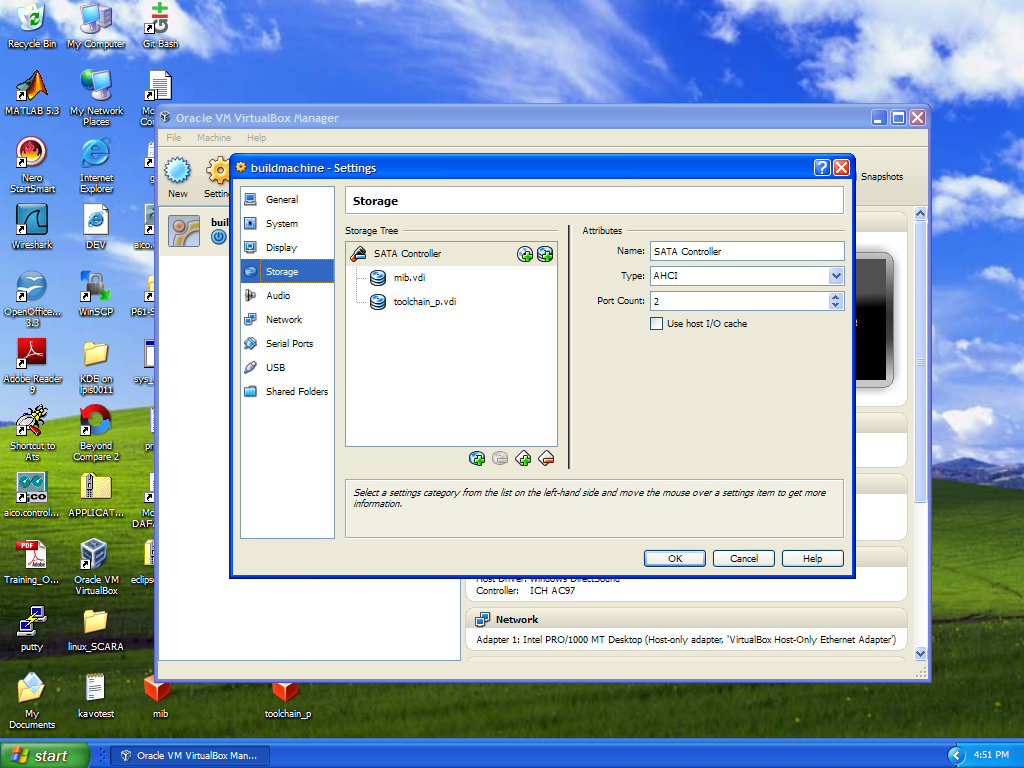
The virtual machine I use to virtual box. Please download and install it. The virtual machine is composed from two virtual disks, mib.vdi and buildDisk.vdi. The mib.vdi is 50MB disk, and buildDisk.vdi is 2 GB disk. This is because the build objects consume a lot of storage. Both disks can be found at //domainaxy/IL/MC/linux/buildmachine . Access to virtual machine is done through the terminal or through ssh with user root , no password required.
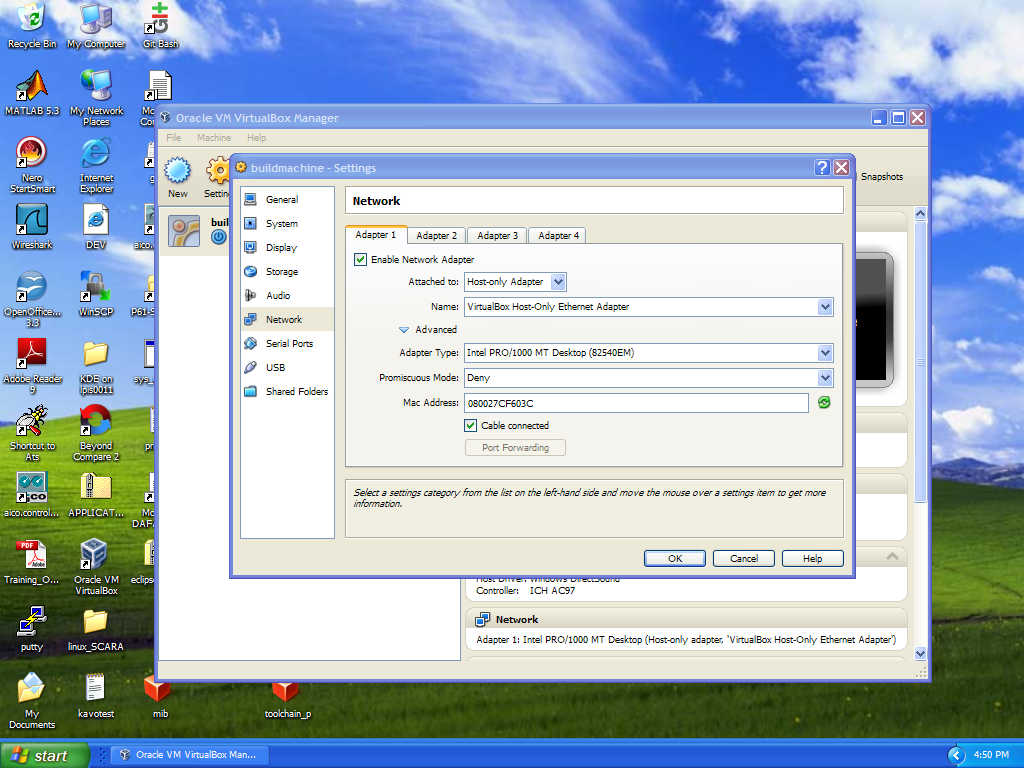
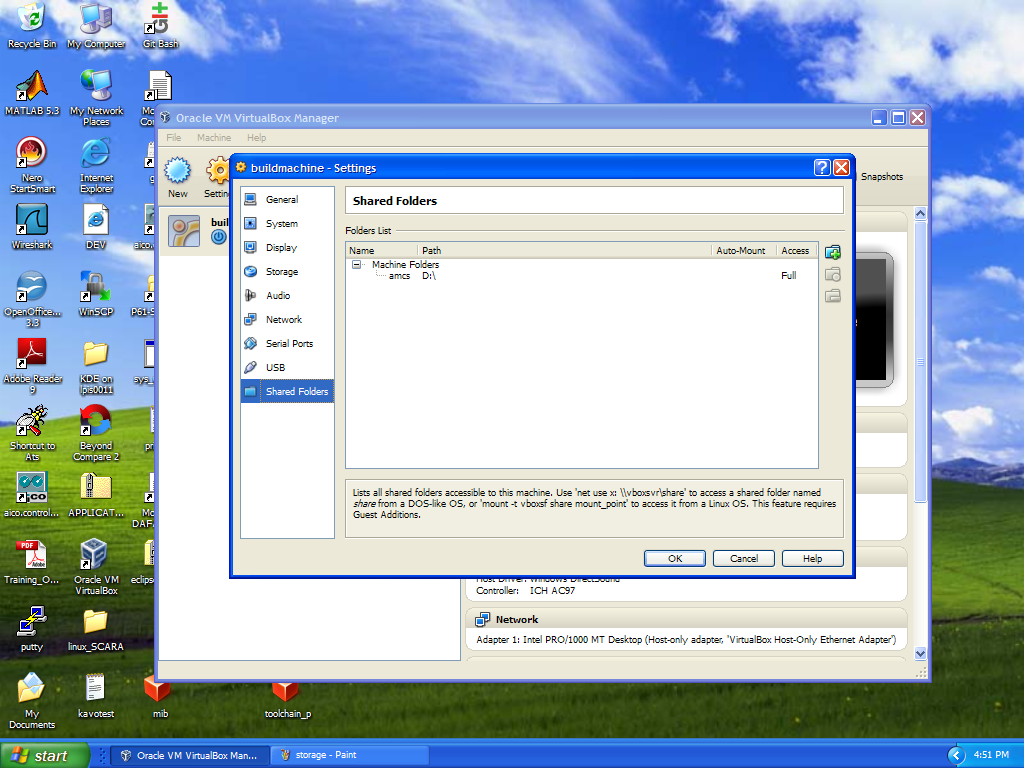
Virtual Box Configuration
storage
Network
share
The guest gets static IP 192.168.56.101 . It is accessible only from the host. We decided to use this configuration as it simplifies things. If you wish to have the Linux connect to the network choose network card attached as bridge and choose intel PRO/1000 MT Desktop.
To have the virtual build machine access s shared folder in the host machine, please add a share name called amcs to whatever folder you wish.
The “amcs” share will mount automatically. Any other share has to be mounted manually in the guest:
mount.vboxsf <share name> <mount point>
Virtual Linux Configuration
The virtual disk containing the toolchain is called toolchain.vdi. Once you boot the virtual build machine you need to make sure build disk is mounted. So check is /opt directory contains OSELAS toolchain. Also, please check the you have network access (with ifconfig) .If all well, please check if you can connect with ssh.
Building MC
- Make sure amcs share is mounted and contains all required sources. Make sure the toolchain is mounted on /opt.
~ # df
Filesystem 1K-blocks Used Available Use% Mounted on
udev 191428 112 191316 0% /dev
tmpfs 76572 144 76428 0% /run
/dev/sda1 147415 85218 54697 61% /
none 191428 0 191428 0% /tmp
none 191428 0 191428 0% /var/log
none 191428 16 191412 0% /var/run
none 191428 0 191428 0% /var/lock
none 191428 0 191428 0% /var/tmp
tmpfs 191428 112 191316 0% /dev
'/dev/sdb 8256952 1784056 6053468 23% /opt'
none 4217028 1366328 2850700 32% /media
Change directory to mc sources (inside the amcs share) or clone them from the linux. if this is the first time you build these sources please configure the build as follows:
$ sh run_configure_all and now you can build these sources:
$ make –j2
If you wish to configure eclipse ontop of the virtual box please refer to this document: Axystems:Eclipse_Stand_Alone_Linux
Once you’re done, you need to copy the binary to the target machine if you have external networking.
scp mc root@10.4.20.240:/usr/bin/mc
else use eclipse terminal to copy.
Troubleshoot
run_configure_all
If run_configure_all fails with numerous errors, edit in linux, and remove all ^M signs.
Out Of memory
Incase during the build you see a message “out of memory” please remove the –j from the make and remake or increase the virtual machine RAM.
Out of disk space
You are probably building on the virtual machine disk. Change to share directory.
Toolchain
The toochain is installed in the /opt/ directory. This requirement is strict and I do not support any other configuration. The toolchain we use is:
Gcc 4.52
Glibc 2.13
Binutils 2.13
Sanitized kernel headers 2.6.36
Your /opt/ directory should contain a directory called:/opt/OSELAS.Toolchain-2011.03.1/.
The BSP
To build the entire bsp you need a linux ubunto server. Building the bsp on a virtual box running ubunto is possible but will take a long time.
You can find the toolchain tar ball
//domainaxy/IL/MC/linux/buildmachine/OSELAS.Toolchain-2011.03.1.tar
Copy it and extract it in the ubunto :
$ sudo tar xvf OSELAS.Toolchain-2011.03.1.tar –C /opt/
Now, clone the bsp:
git clone git@10.4.20.38:/home/git/bsp.git
to build the bsp master branch :
cd bsp/
ptxdist go
at the end of the process you will have linuximage in platform-i586/images. This is not enough as you need to build to full image , for this run the bellow command:
ptxdist images
the image is hd.img. To burn it to the sdcard please:
sudo dd if=platform-i586/images/hd.img of=/dev/sdX
when /dev/sdX is the sdcard device name. if you don’t the device name, do not bother dd’ing, you will probably destroy the build server.
Once you dd’ed, please sync and eject:
sync
eject /dev/sdX
Replicate an image
There are times where one wishes to replicate an existing image. To do that he must copy the source image as file to some Linux machine using dd and then burn the source file image to new card. Here are the steps to do that:
- Place in the card reader the source flash card. Linux will notice a new disk was pushed in.
- dmesg and look for the new disk name, like /dev/sdd or/dev/sdb.
It will appear in the bottom of the dmesg log, for example:
[422238.883418] sd 9:0:0:0: [sdd] Assuming drive cache: write through
[422238.883423] sd 9:0:0:0: [sdd] Attached SCSI removable disk
[422470.346994] EXT3-fs: barriers not enabled
[422470.735075] kjournald starting. Commit interval 5 seconds
[422470.735121] EXT3-fs (sdd1): warning: maximal mount count reached, running e2fsck is recommended
[422470.736077] EXT3-fs (sdd1): using internal journal
[422470.736083] EXT3-fs (sdd1): recovery complete
[422470.737199] EXT3-fs (sdd1): mounted filesystem with ordered data mode
The device ( disk ) in my machine is /dev/sdd. It has a single partition called /dev/sdd1.
- Now copy the card to a file using dd: for example, if my disk name is /dev/sdb I enter:
$ dd if=/dev/sdb bs=1M of=/tmp/hd.img
$ sync
- Now pull out the source sd card, and place the new card.
- Push back the target flash card, and then:
$ dd if=/tmp/hd.img of=/dev/sdb
$ sync
How to edit files in MIB
There are cases where a user needs to edit a text file in the LinuxMIB. LinuxMIB has two editors, nano and vi.
vi is considered more powerfull than nano. Yet, I believe that the regular user should start with nano as it is more intuitive.
Upgrade Linux MIB
Linux MIB is shipped with a debian based packaging system. This means that to any update is wrapped with ipkg. Once the package is ready, simply copy the package file to the target to the inbox directory.
scp mc-4.9.0-linux.ipk 10.4.20.240:/inbox/ or by drag-and-drop through windows operating system with winscp.
Packaging is triggered automatically. I wrote a package manager daemon that listens on /inbox directory and if a new file is put there it tries to install it.
You can list the packages with the following command:
dpkg -l
Currently you cannot uninstall a package, you have to remove the files manually.I believe it is a pengutronix bug.
Control MC Start
One of the first things a programmer does when developing is disabling the automatic start of the application he is debugging. In manz case it is mostly the mc.
There are two ways to disable automatic starting:
- Each time you boot.
# ~ /etc/init.d/mc stop
- Edit /etc/init.d/mc script and remark the mc launching as follows:
…
start)
/etc/init.d/run_config
# nohup /bin/sh /usr/bin/mc.sh &
Add # before the nohup as depicted in the line above.
Debugging
Debugging mc can mostly with eclipse. Please refer to eclipse documentation to learn how to do that.
Logs
In addition to the log files in /RAM file system. We added a linux-like logger which can be found at /var/syslog.
Core files
A core file is a snapshot of the process memory when it crashed. It is a post mortem debugging method commonly used. All cores files are generated to /cores directory. There will no more than 5 cores. The 6-th core is written on the first core.
To debug a core dump you must compile the same mc with debug info and copy the core file to the ubunto ( virtual build machine is not suitable for that ). Then type:
gdb mc coredump
Memory Detector
To debug memory leaks you need valgrind. Valgrind is not installed as is in the bsp, simply take a package and put it in the target. If you do not know how to use valgrind I suggest you refer to valgrind web site. It is beyond the scope of this paper.
MC cli
MC Linux is shipped with a telnet server. This telnet server resembles the vxworks terminal.
To login please:
~ # telnet localhost:8000
Entering character mode
Escape character is '^]'.
AMCS shell
User name is root and password qwerty.
Username: root
Password:
The telnet is evolving and the command may differ from one version to another but to get help you can simply type help.
> help
Commands available:
help Show available commands
logout Disconnect
history Show a list of previously run commands
threads print all threads
stack trace print the stack of a given thread
p print a symbol
exit exit the process
>
Profiling
Profiling MC can be done with oprofile. To use oprofile you need to boot a kernel with oprofile support, and replace the drivers. For this you will have to install a package called kernel-oprofile.ipk and boot this kernel.
To use oprofile please:
$ opcontrol –reset
$ opcontrol –deinit
$ opcontrol –init
Now to choose type of event you should make sure your processor support this type of event – if any.
$ opcontrol –list-events
Let say you wish to check memory references.
$ opcontrol –event:DATA_MEM_REFS:30000
The above command sets the event memory references each time the a a hardware counter finish counting to 30000.
$ opcontrol –session-dir=/home/myoprofile
$ opcontrol –sparate=cpu
$ opcontrol –callgraph=10
$ opcontrol –novmlinux
$ opcontrol –start
./prog..
$ opcontrol –stop
Now copy the entire profiling results to your local machine home user.
$ opreport –session-dir=/home/raz/myprofile
CPU_CLK_UNHALT...|LLC_MISSES:466500|
samples| %| samples| %|
------------------------------------
943 100.000 1 100.000 prog
CPU_CLK_UNHALT...|LLC_MISSES:466500|
samples| %| samples| %|
------------------------------------
709 75.1856 1 100.000 prog
234 24.8144 0 0 libc-2.11.1.so
To get annotation per line use, run this from the mc directory. This way opannotate will find the source code.
$ opanotate –s session-dir=/home/raz/myprofile
Please note if you intend to use oprofile please read the tutotial as it is beyond the spec of this paper.
ftrace
I do not want to write what is ftrace in this book, please refer to the ftrace tutorials to do that:
Here are the steps to ftrace.
Boot the same kernel as the one for ftrace.
$ mount –t debugfs /sys/kernel/debug /debug
$ cd /debug/tracing/
$ echo 0 > tracing_on
$ echo function > current_tracer
$ echo 1 > tracing_on
….
$ echo 0 > tracing_on
File “trace” contains the tracing information. It a huge text file:
$ cat trace
A visual view for ftrace output is known as kernelshark.
To use it please issue the bellow command after you are done with the trace.
$ trace-cmd extract
A local file named trace.dat is created . copy it to your ubunto and launch kernelshard.
$ kernelshark trace.dat
